User Guide
Everything you need to build, deploy, and manage your AI assistants — step by step.
Analytics & Reports
Understand how your agents are performing with built-in analytics.
The ChatNexus dashboard provides analytics to help you understand usage patterns, agent performance, and resource consumption. The level of detail available depends on your plan.
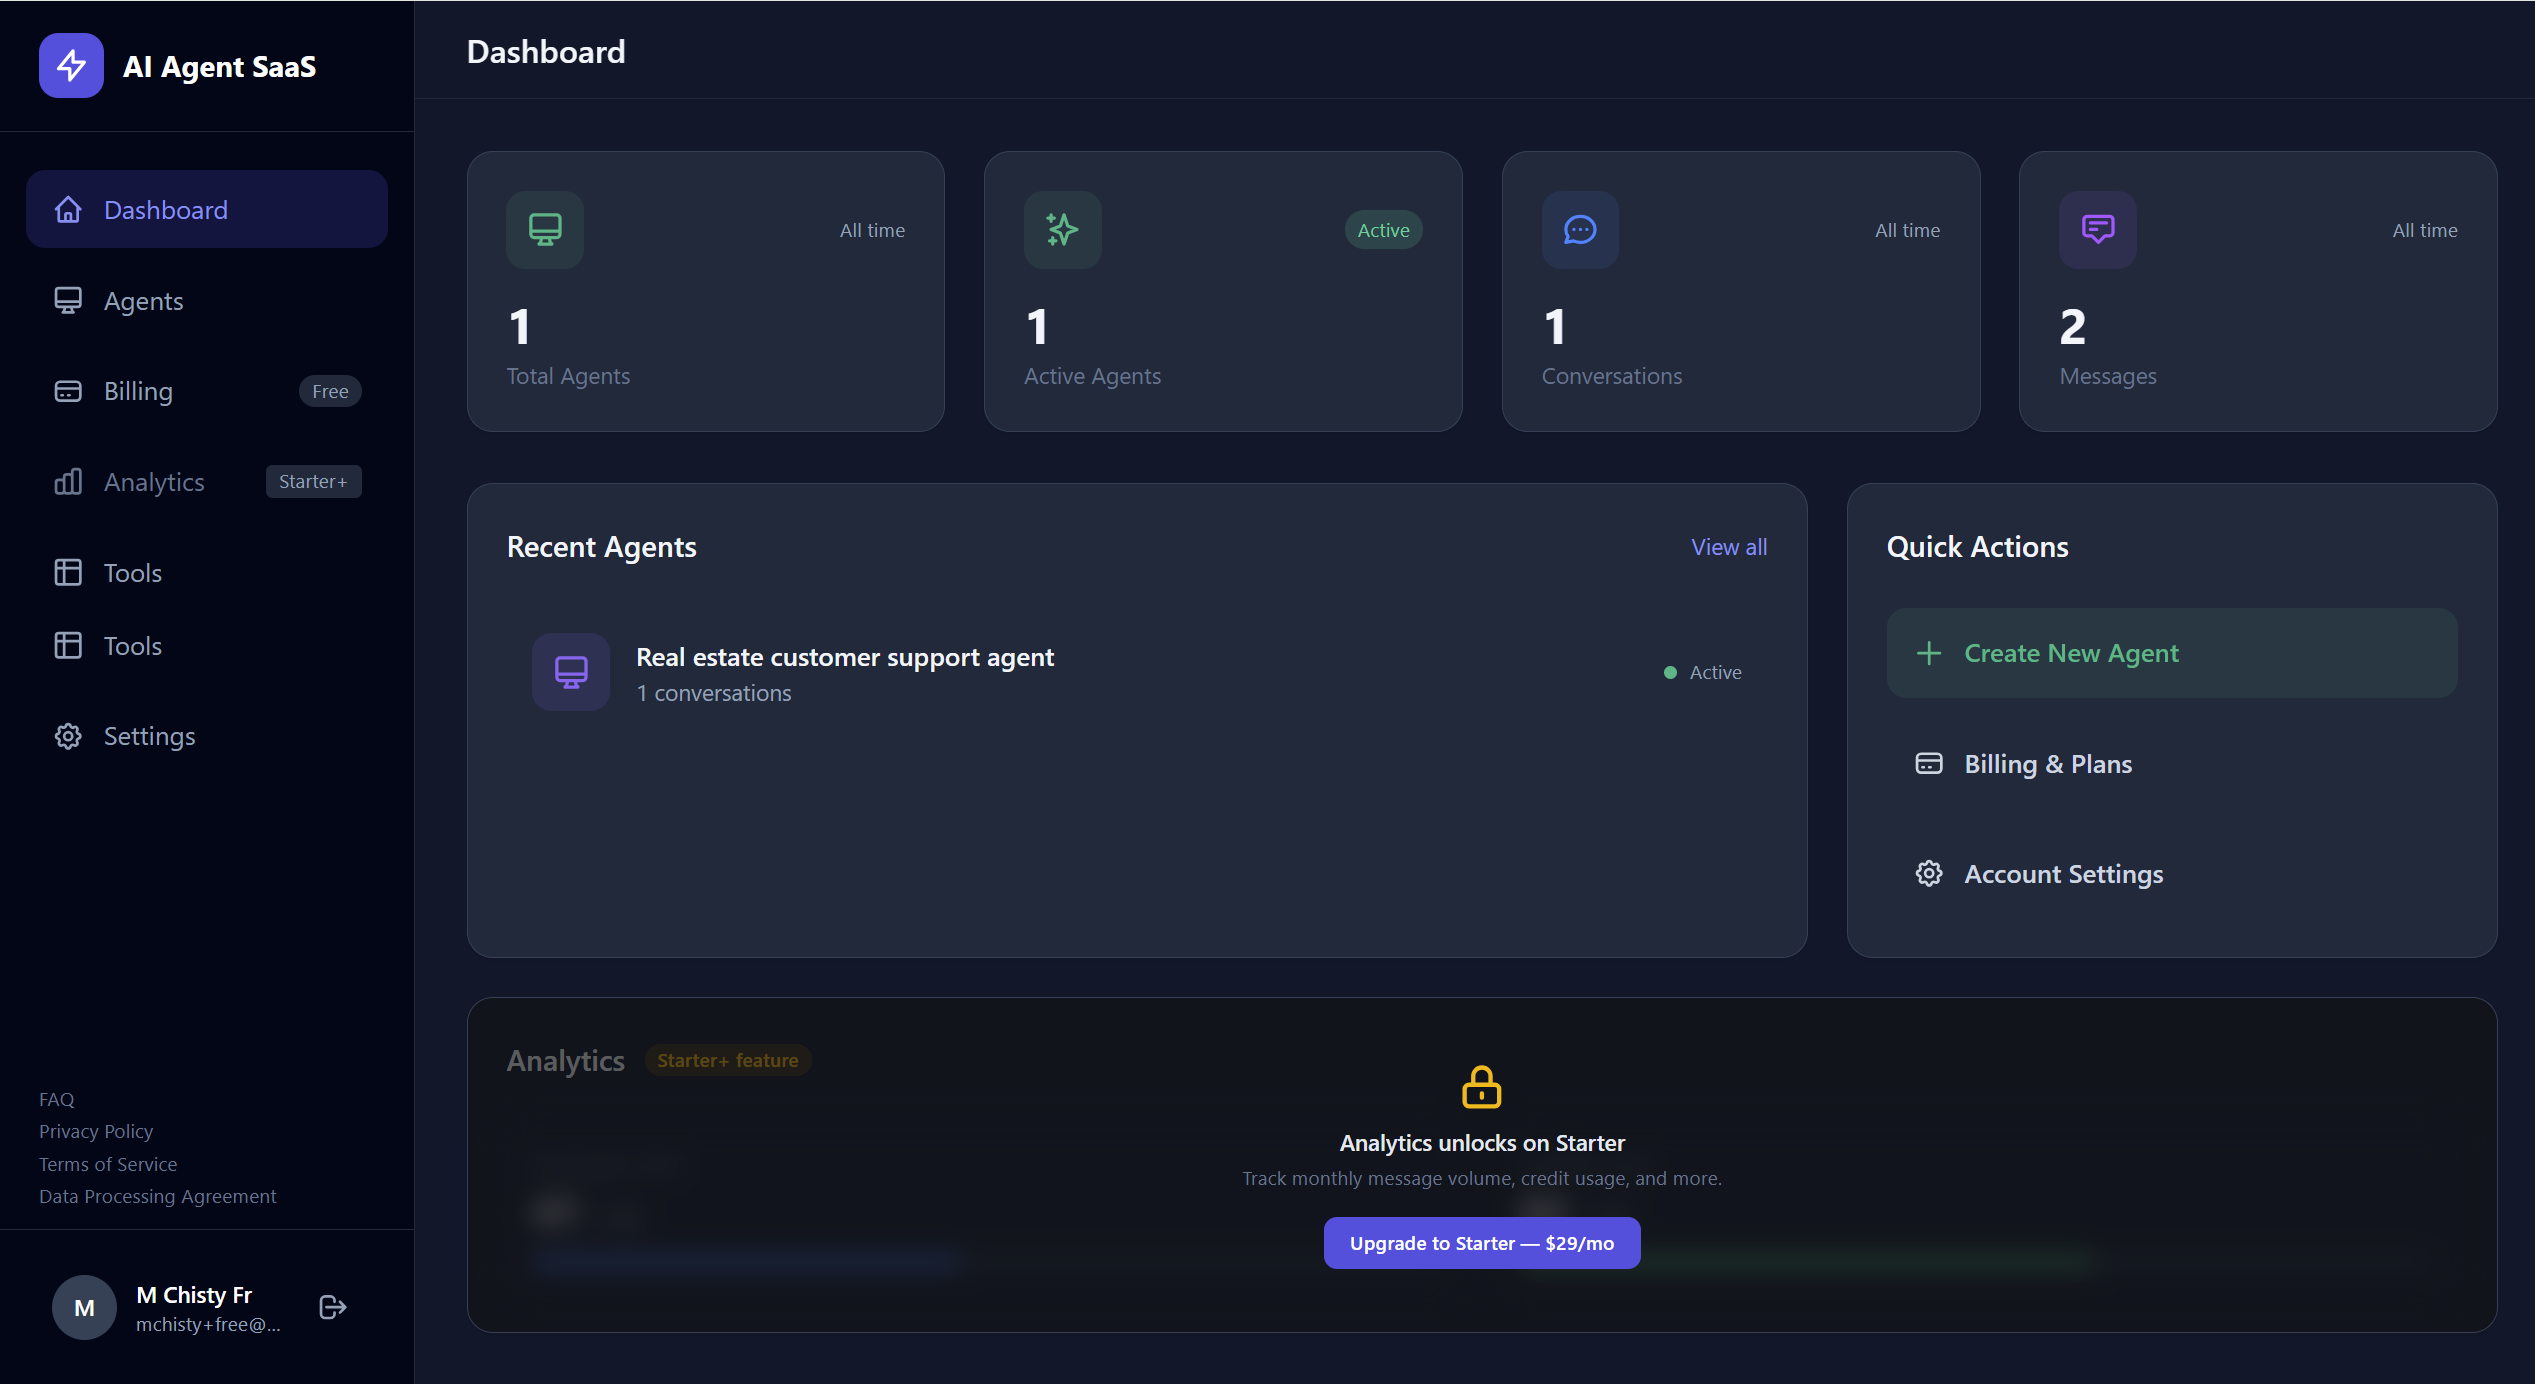
Basic Statistics All Plans
Every user - including Free plan users - has access to basic statistics on their dashboard:
- Total agents and active agents count
- Total conversations across all agents
- Total messages sent this month
- Credit usage - how much of your monthly quota has been consumed
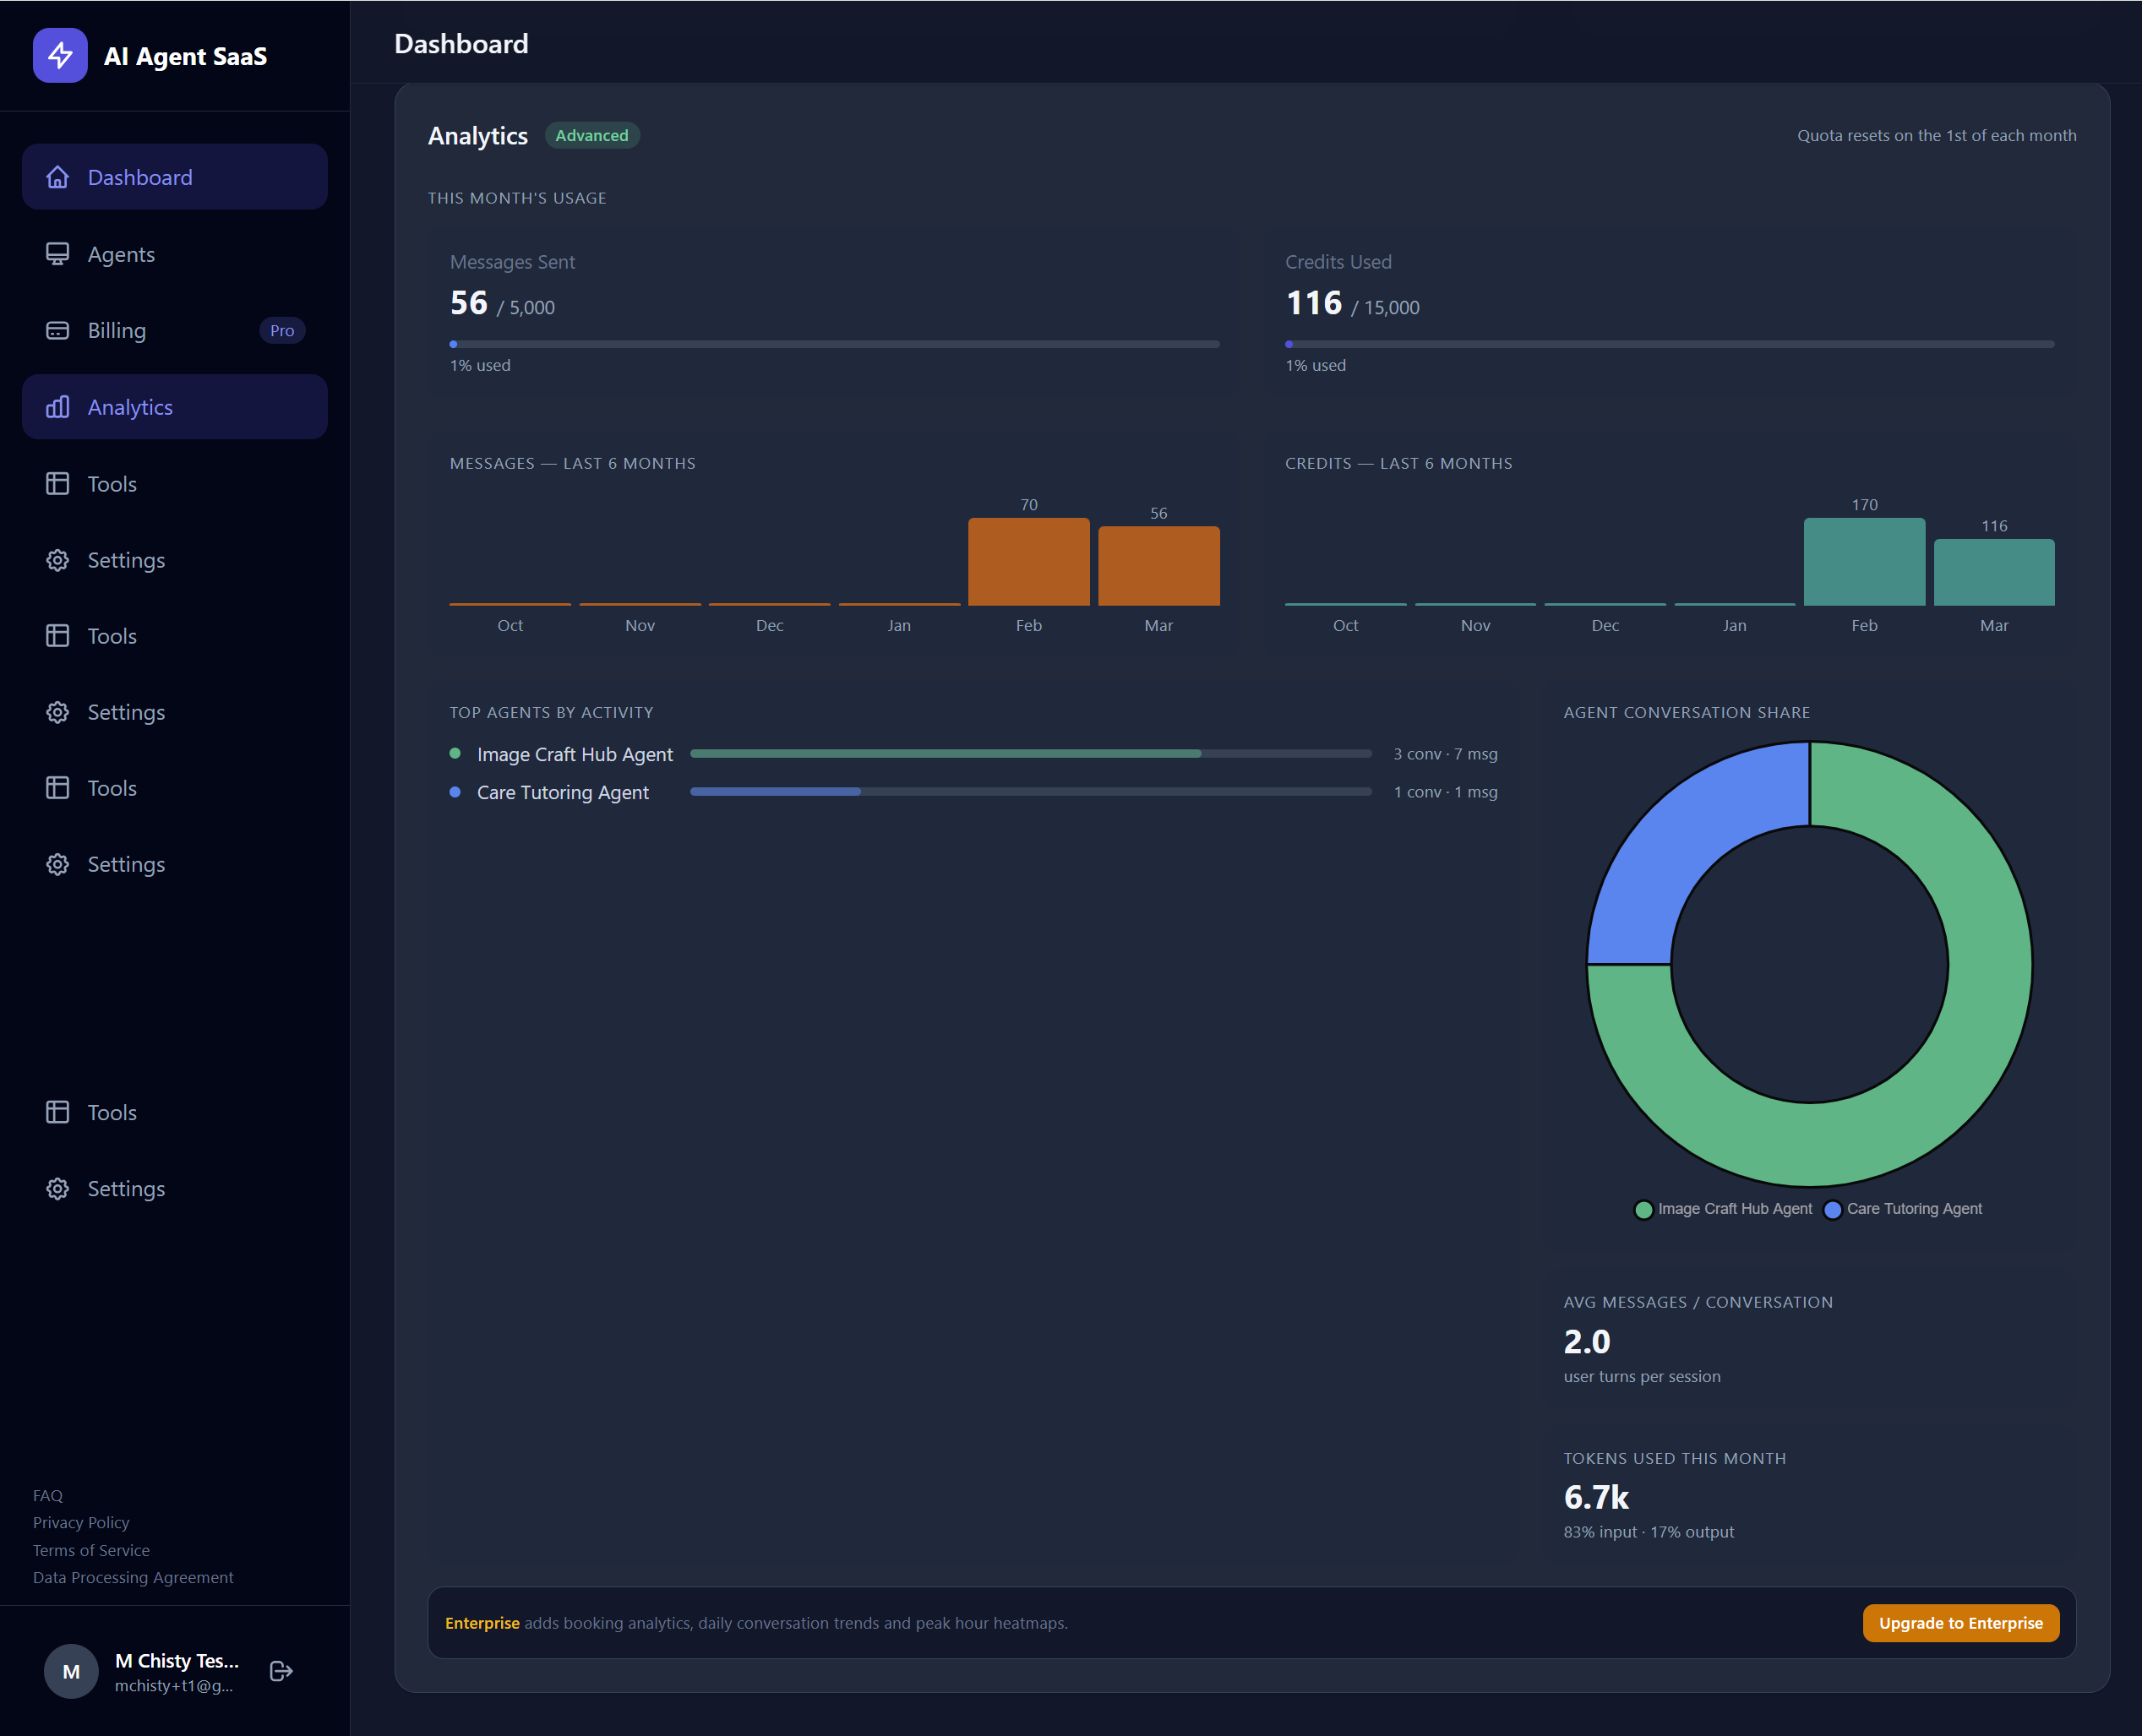
Advanced Analytics Pro & Enterprise
Pro and Enterprise users unlock detailed analytics with trend data and per-agent breakdowns:
📈 6-Month Trends
View message volume and credit consumption trends over the past 6 months with visual charts. Spot usage spikes and growth patterns.
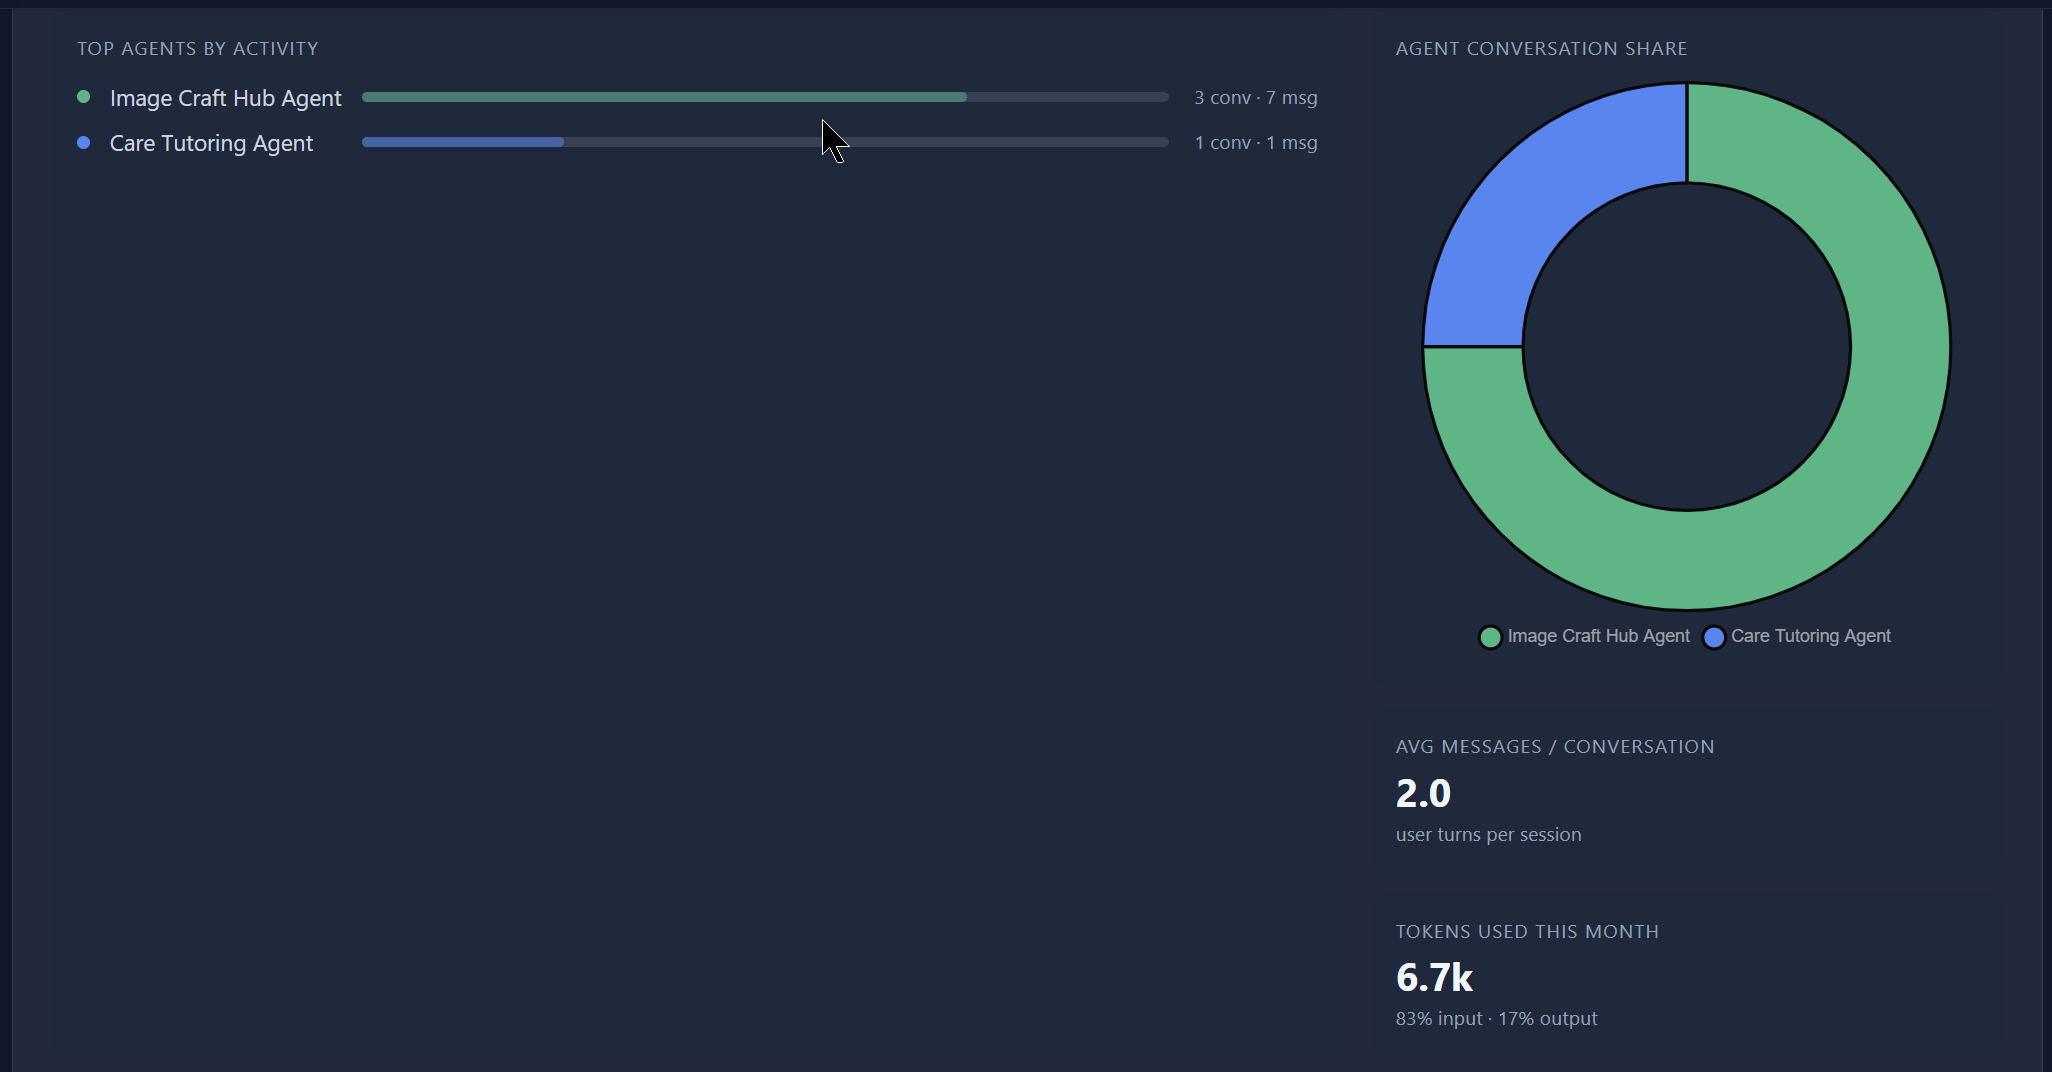
🤖 Per-Agent Breakdown
See which agents are getting the most activity - including conversation count, message count, and average conversation length per agent.
🔢 Token Statistics
Track input and output token usage to understand AI consumption costs and optimise your prompts for efficiency.
Comprehensive Analytics Enterprise
Enterprise users get access to the full suite of analytics, including all Advanced metrics plus additional enterprise-grade insights for compliance, auditing, and operational monitoring.
Analytics Features by Plan
| Feature | Free | Starter | Pro | Enterprise |
|---|---|---|---|---|
| Basic stats (agents, messages, credits) | ✓ | ✓ | ✓ | ✓ |
| Usage vs. limit tracking | ✓ | ✓ | ✓ | ✓ |
| 6-month message & credit trends | - | - | ✓ | ✓ |
| Per-agent activity breakdown | - | - | ✓ | ✓ |
| Token usage statistics | - | - | ✓ | ✓ |
| Comprehensive enterprise metrics | - | - | - | ✓ |